Step 2: Set up the build system: JDK and Gradle
Ensure that the project is synchronized
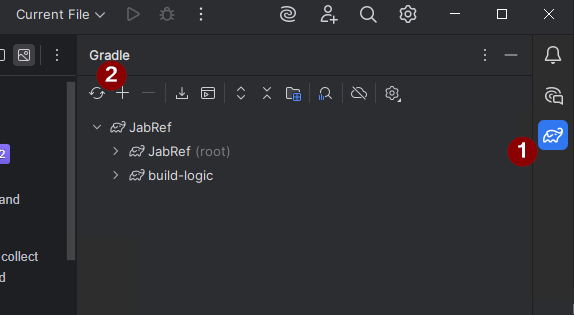
Press the synchronization button in the gradle menu.
- Locate the gradle icon on the right side and click on it.
- Click on the arrows on the left side of this pane.
Press Alt+1 to show the project view
Then, on the left side the project folder is there:

Switch JDK to the latest one
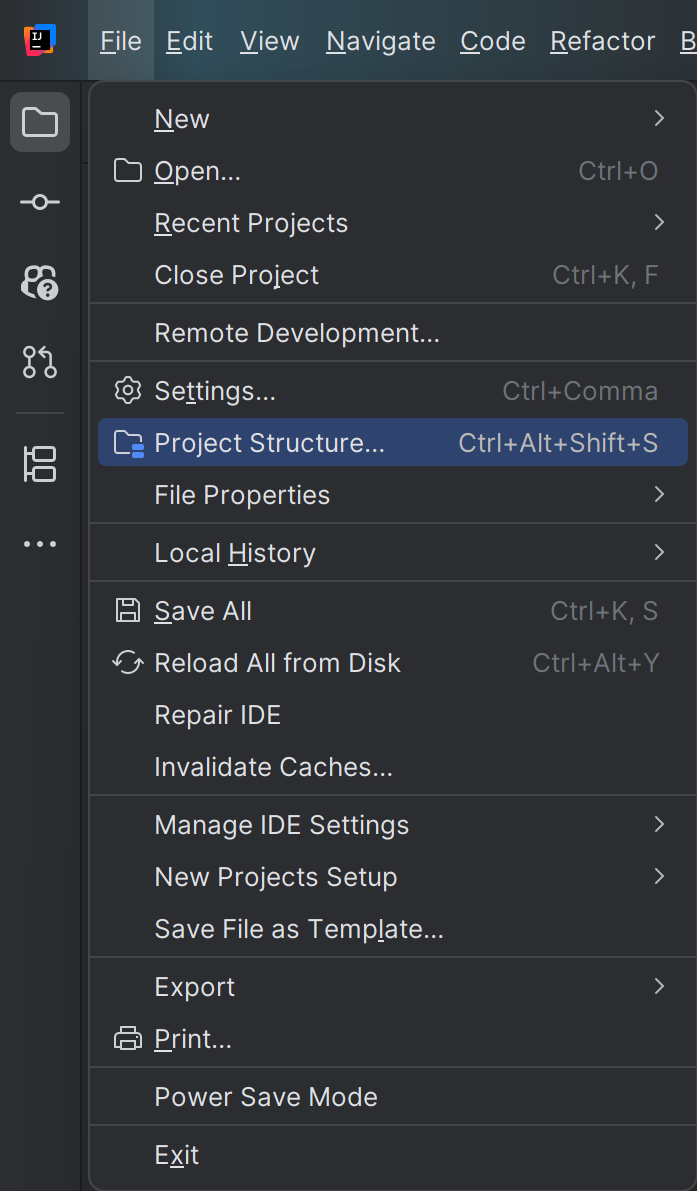
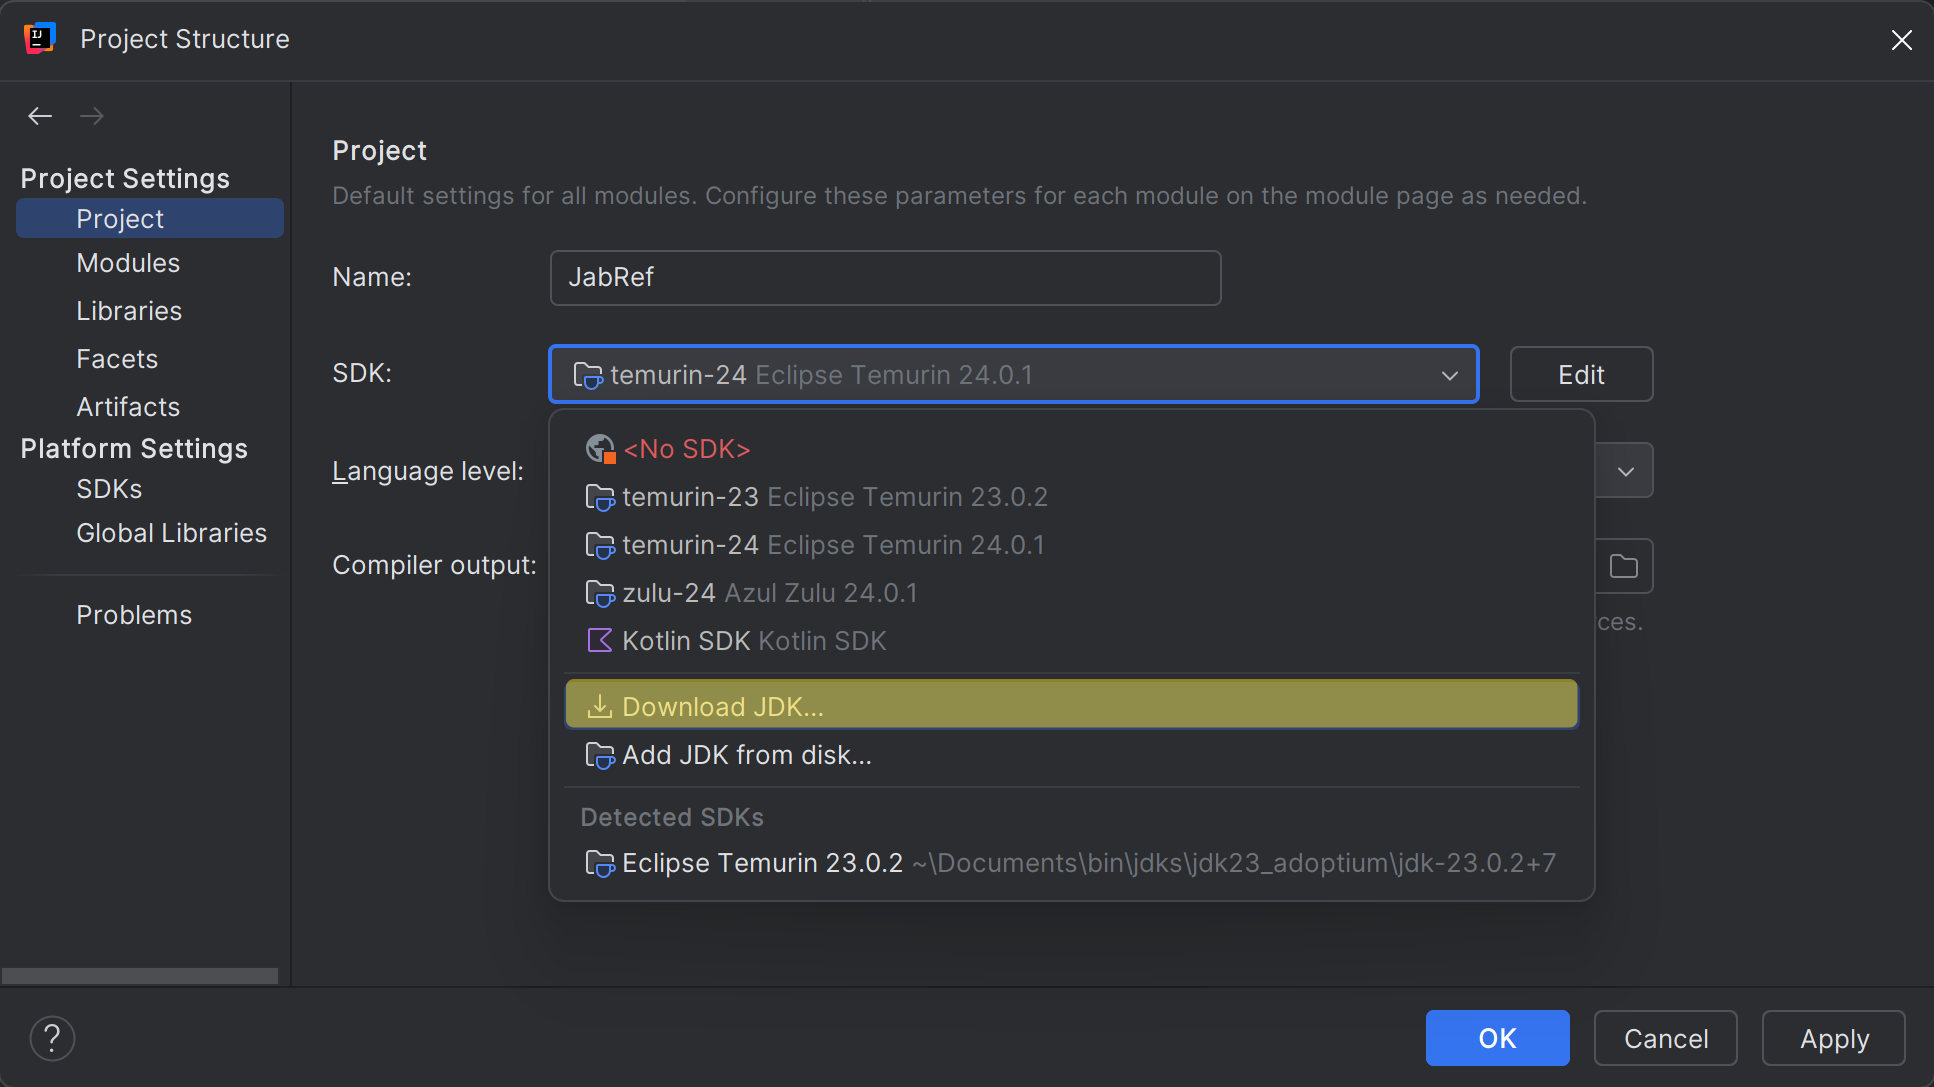
Go to “File > Project Structure” or press Ctrl+Shift+Alt+S.
Click on “Project” on the left side. Then, select temurin-25 as the project SDK (continue reading if this option is not available).
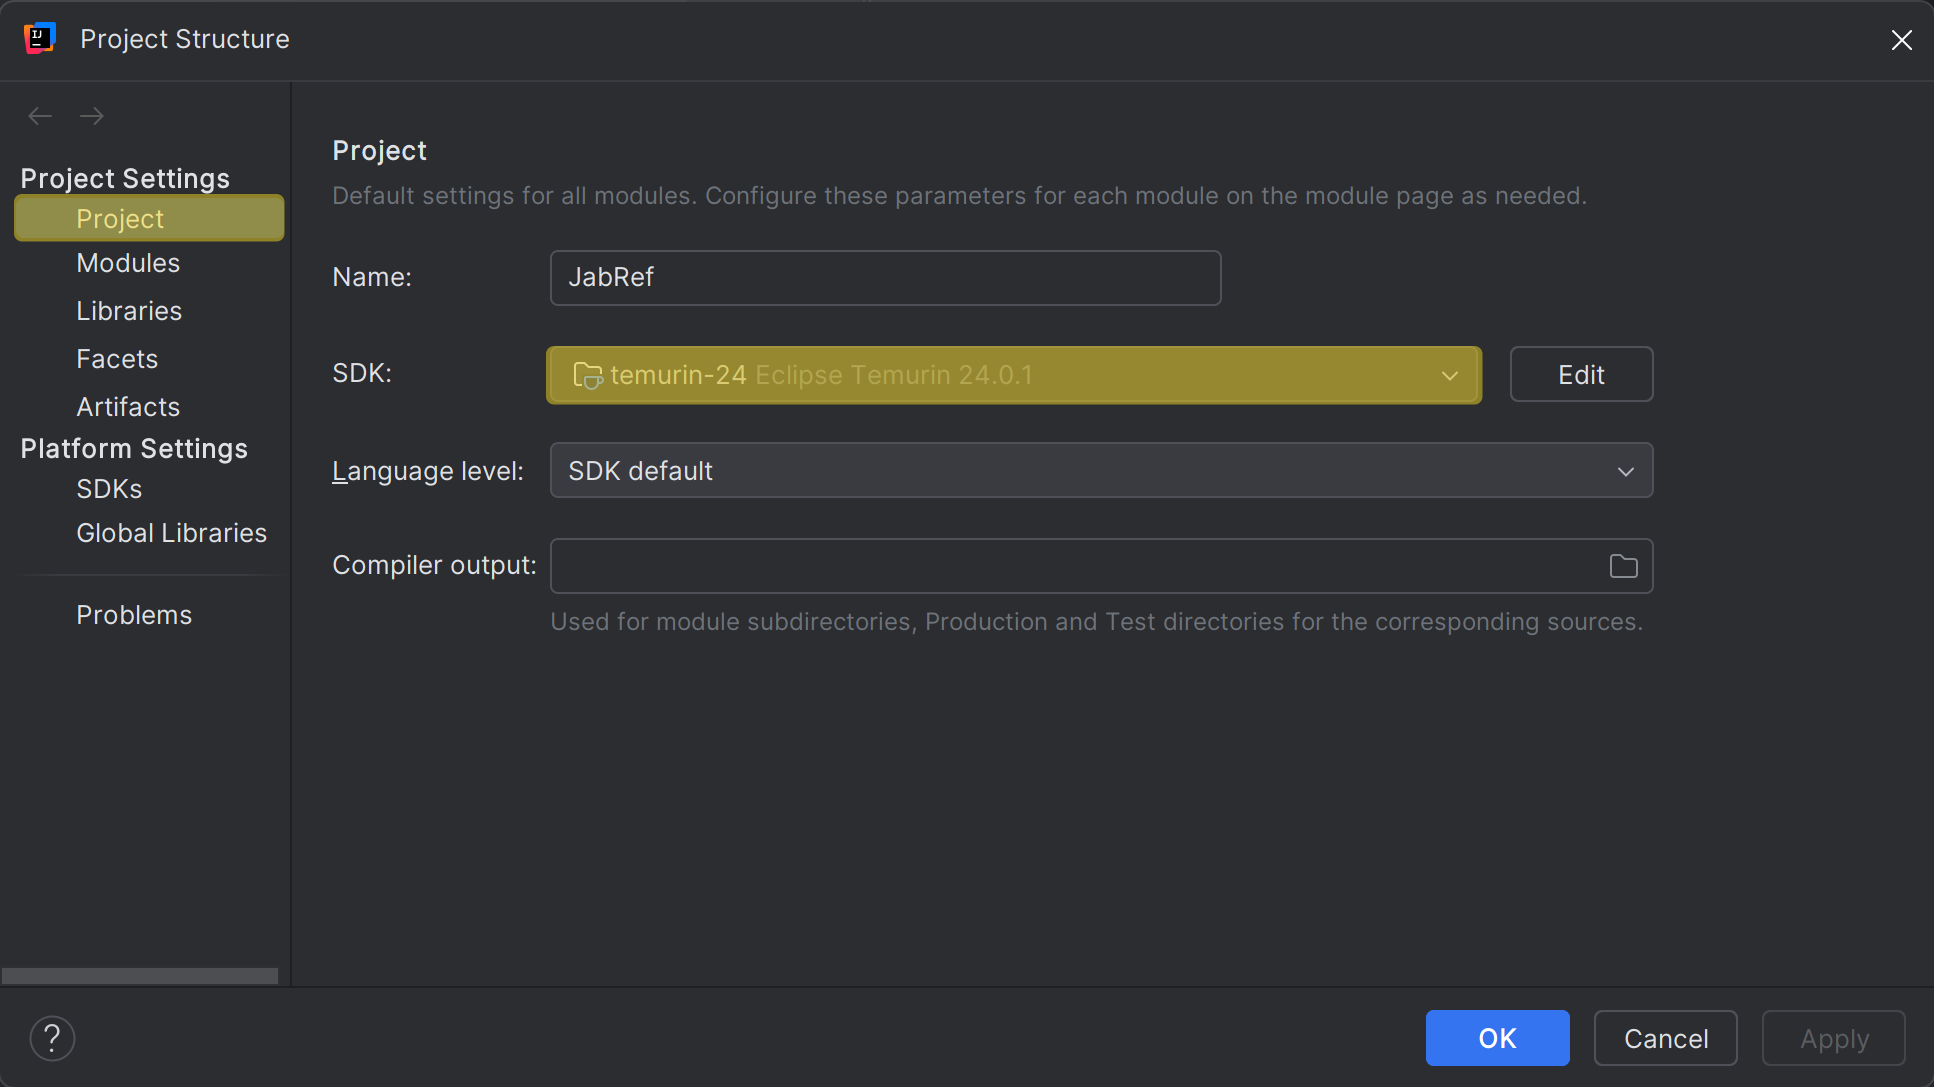
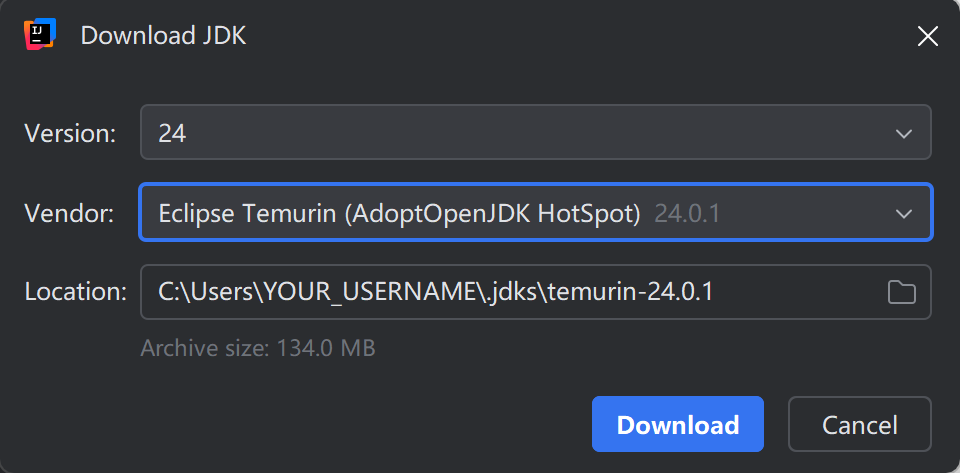
If you do not have access to this JDK, download it by clicking on “Download JDK…” In the dialog that opens, select version 25, vendor “Eclipse Temurin (AdoptOpenJDK HotSpot)”, and click “Download”.
Finally, enable the JDK:
- Click “OK” to close the dialog “Project Structure”.
- Wait for IntelliJ to index the new JDK.
- If IntelliJ crashes, restart it. At “Help > Memory Settings”, increase the “Maximum Heap Size”.
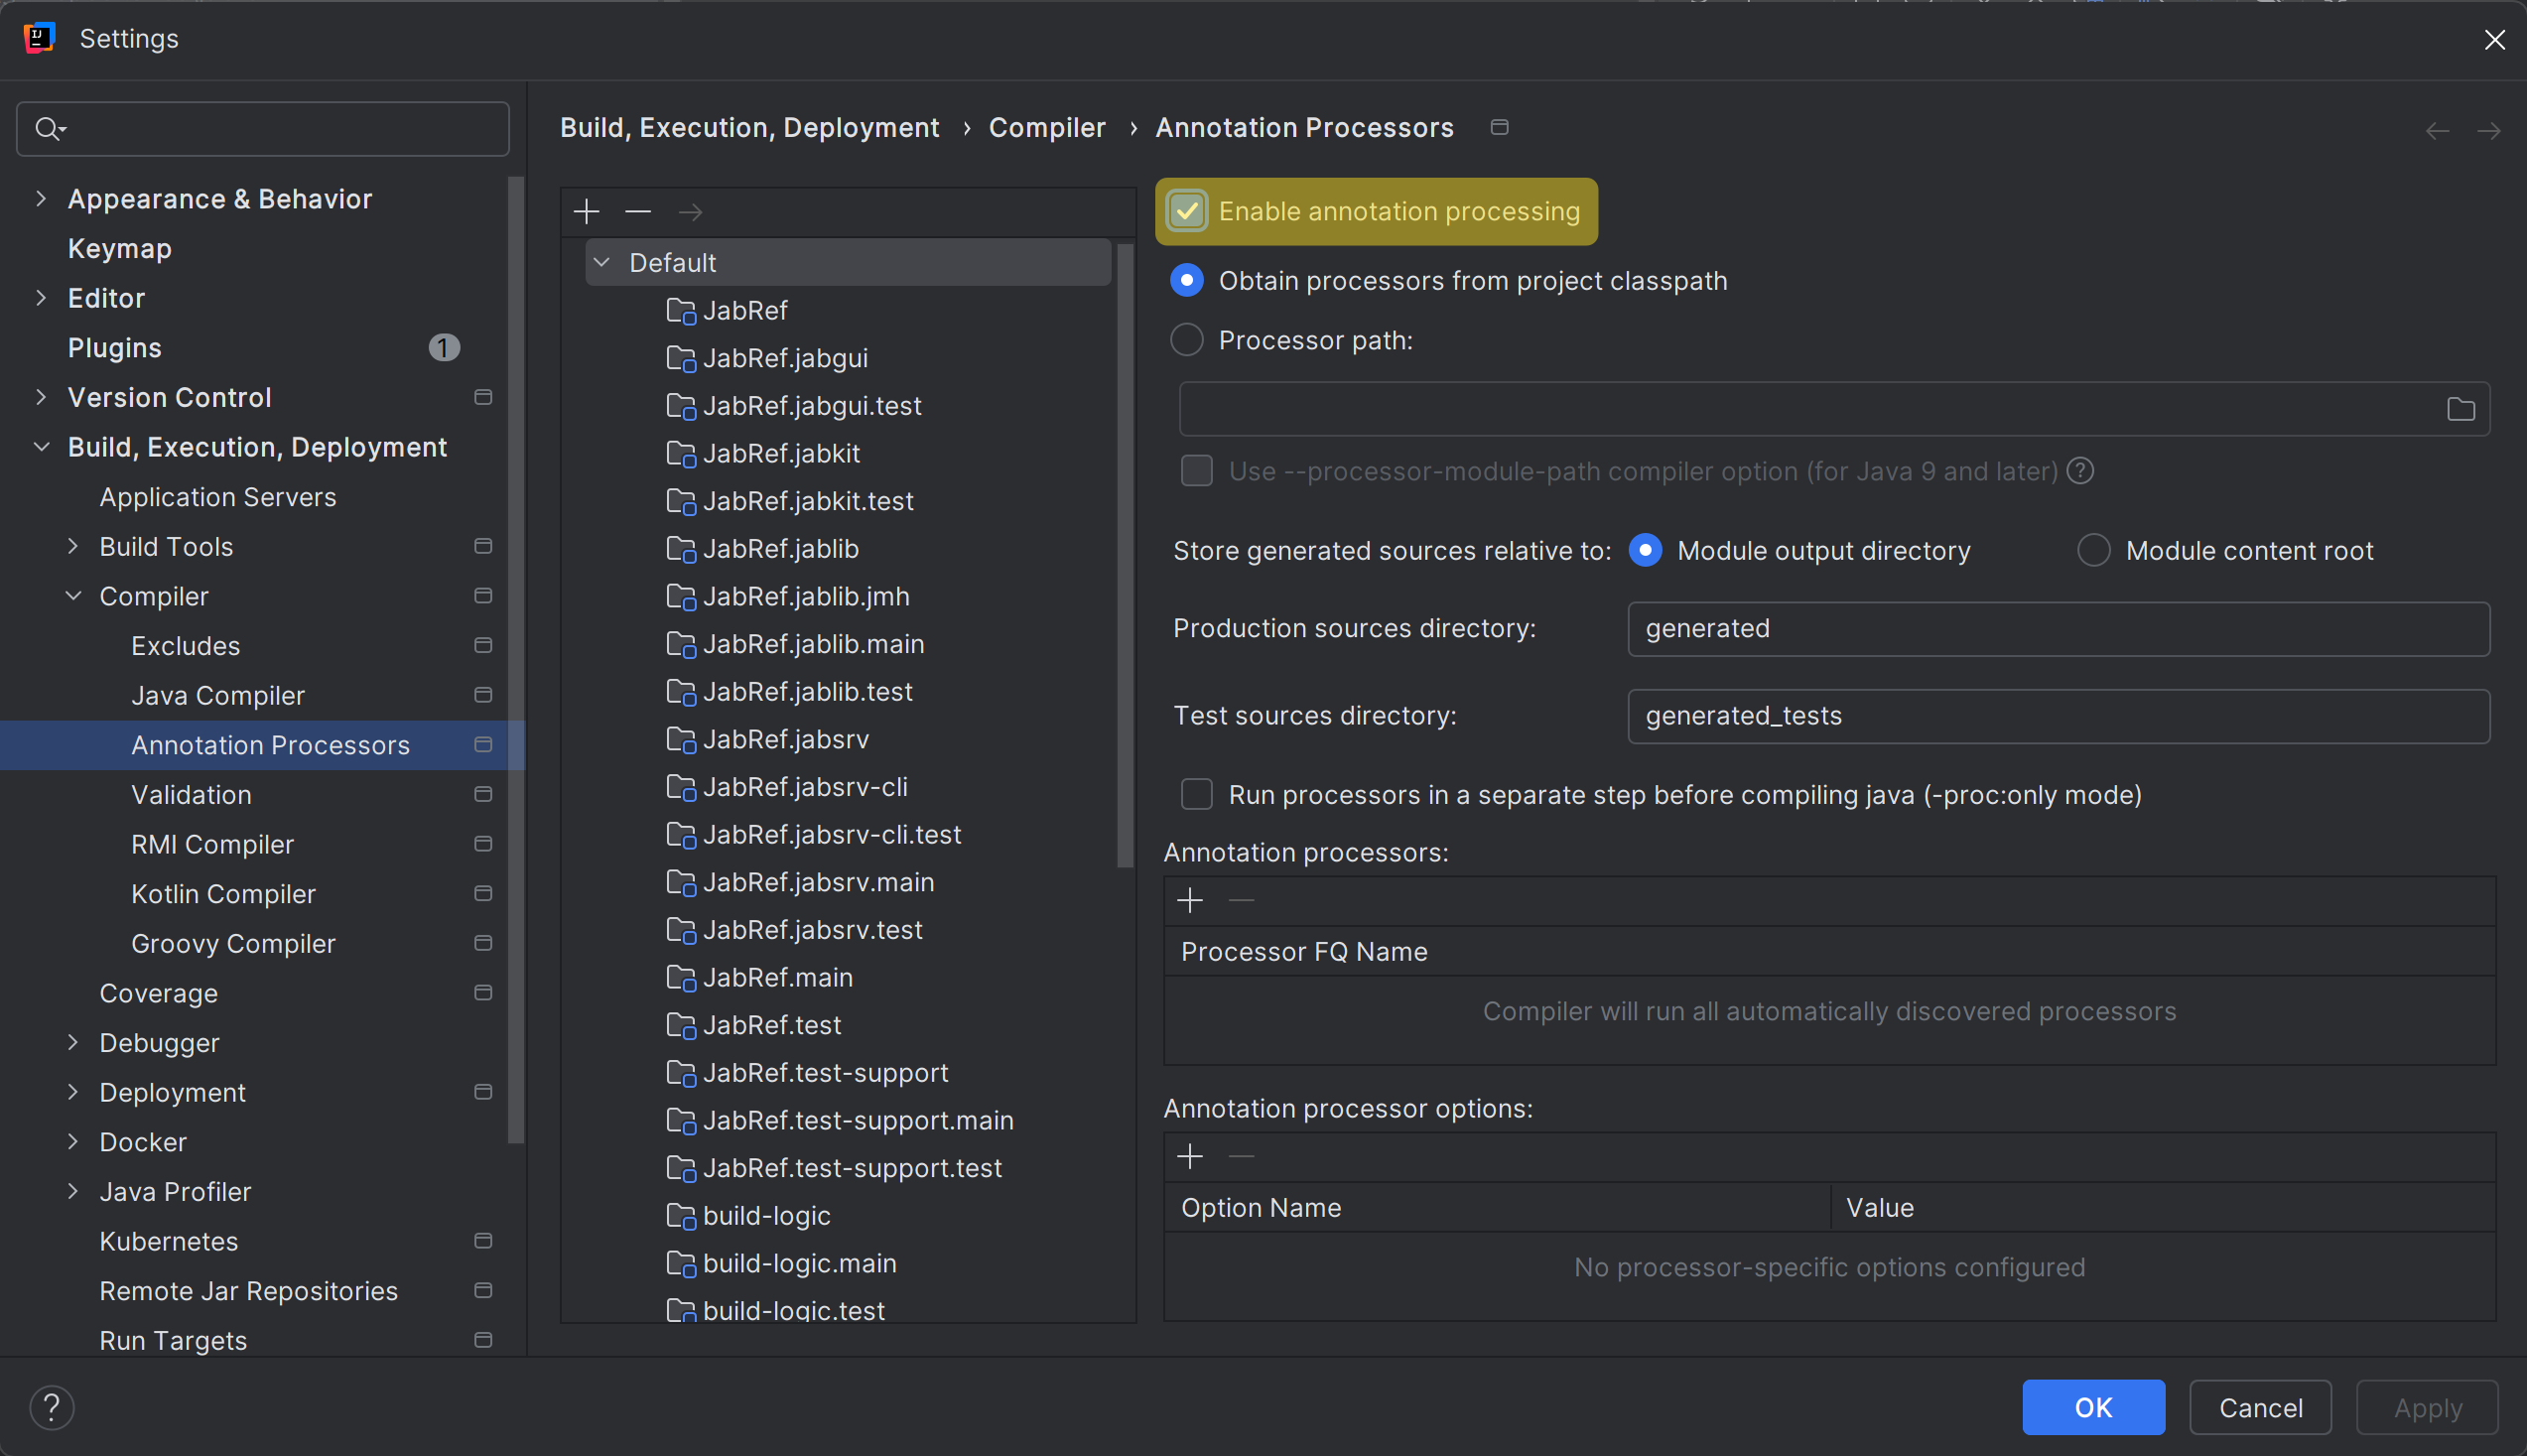
Enable annotation processors
Enable annotation processors by navigating to File > Settings > Build, Execution, Deployment > Compiler > Annotation processors and check “Enable annotation processing”
Using Gradle from within IntelliJ IDEA
Ensuring JabRef builds with Gradle should always be the first step since this is the commonly supported way to build JabRef.
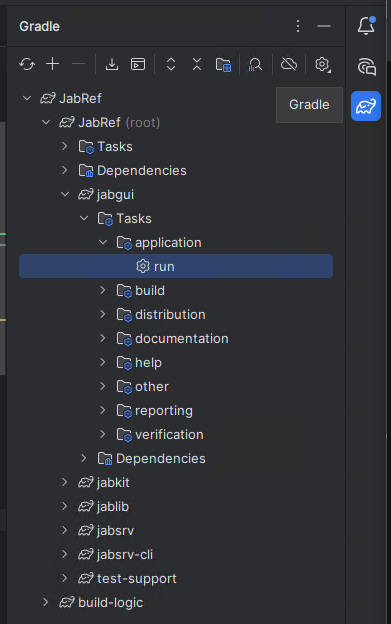
Use the Gradle Tool Window to build all parts of JabRef and run it. To do so, expand the JabRef project in the Gradle Tool Window, navigate to “jabgui”, expand it, navigate to “application”, expand it, and double click “run”.
The Gradle run window opens, shows compilation and then the output of JabRef. The spinner will run as long as JabRef is open.
You might get an out-of-memory-exception as follows:
OpenJDK 64-Bit Server VM warning: INFO: os::commit_memory(0x00000000cb600000, 177209344, 0) failed; error='The paging file is too small for this operation to complete' (DOS error/errno=1455)
You can close JabRef again.
After that a new entry called “jabref [run]” appears in the run configurations. Now you can also select “jabref [run]” and either run or debug the application from within IntelliJ.
You can run any other development task similarly.
Enable compilation by IntelliJ
This is currently not possible due to IDEA-3733059.
Using IntelliJ’s internal build system for tests
This is currently not possible due to IDEA-3733059.
Final build system checks
To run an example test from IntelliJ, we let IntelliJ create a launch configuration:
Locate the class LocalizationConsistencyTest: Press Ctrl+N. Then, the “Search for classes dialog” pops up. Enter localizationconsistencytest. Now, LocalizationConsistencyTest should appear first:
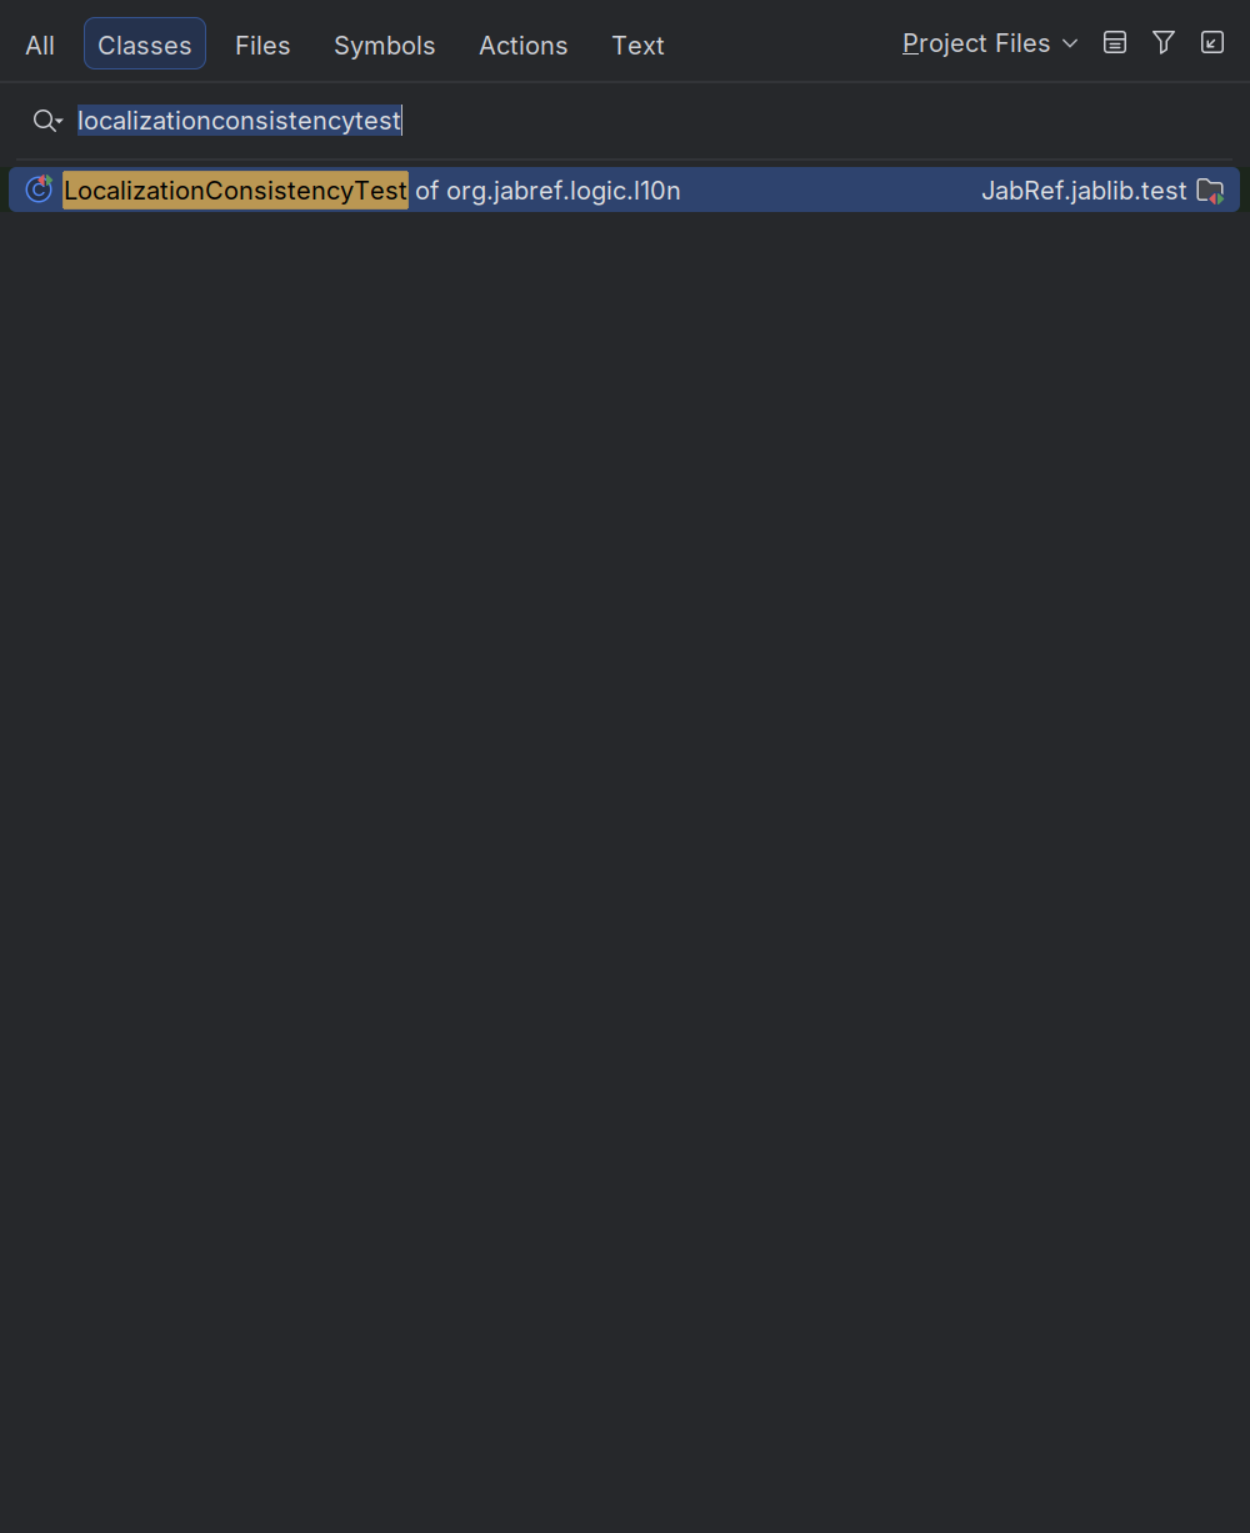
Press Enter to jump to that class.
Hover on the green play button on findMissingLocalizationKeys:
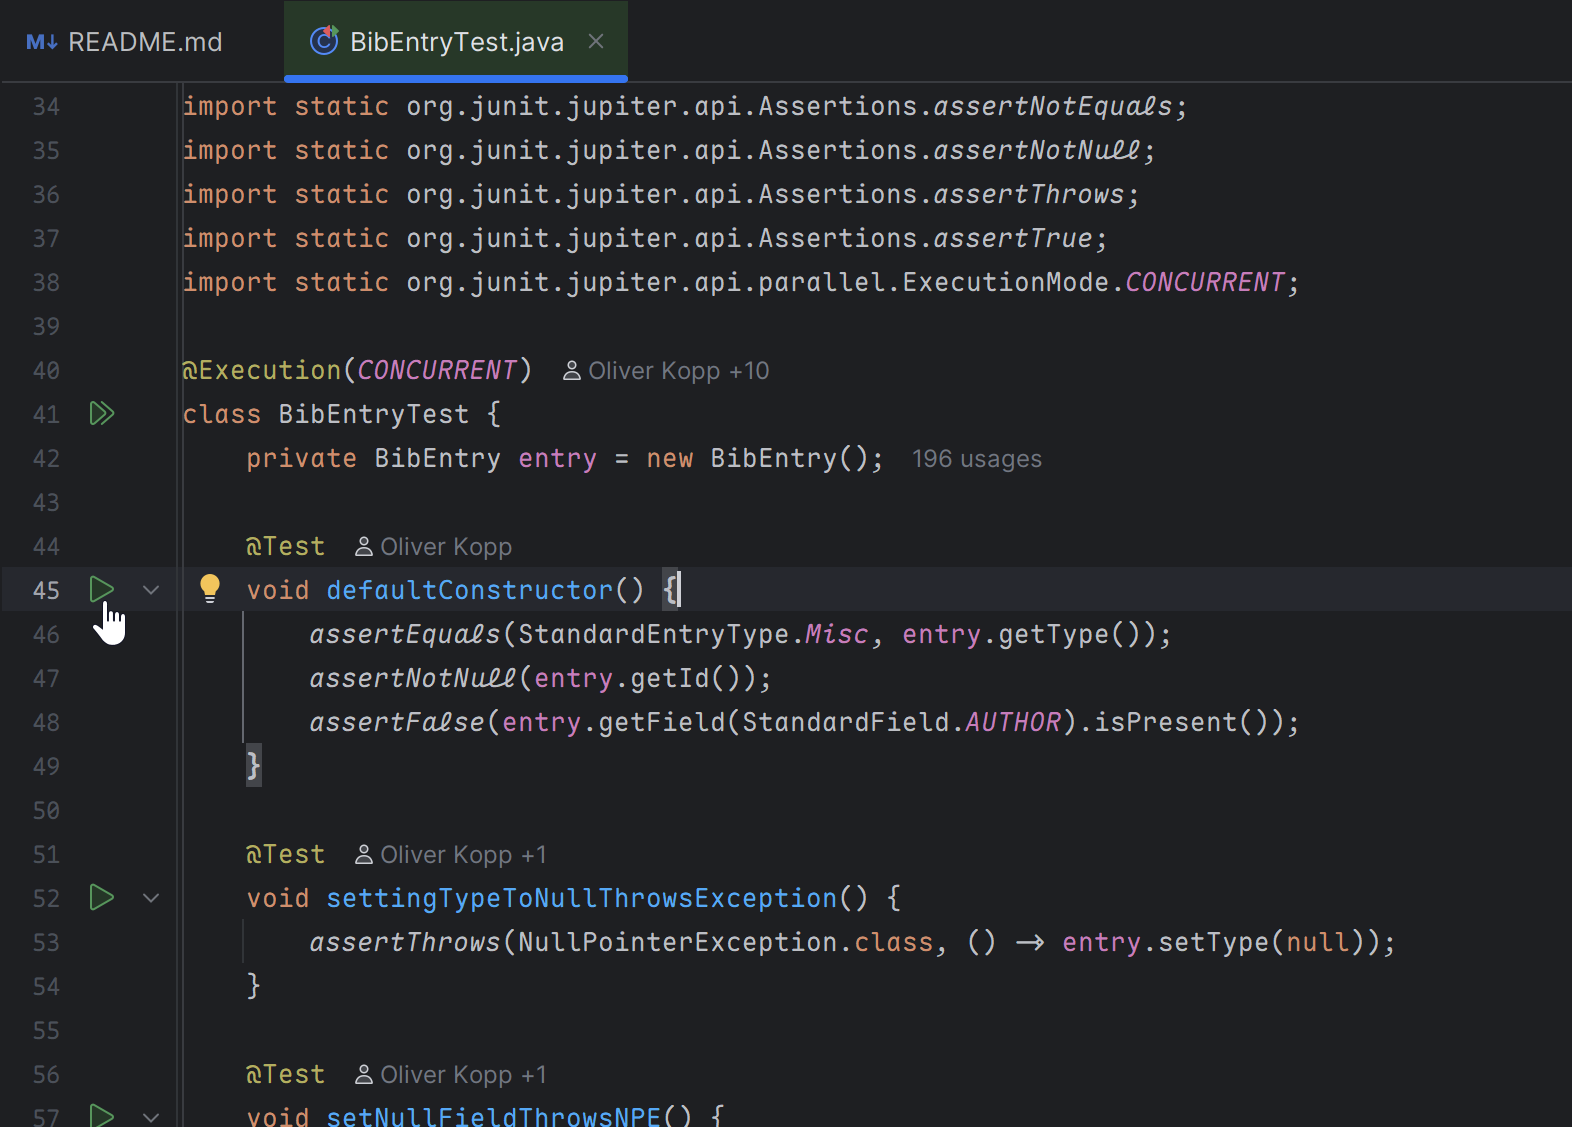
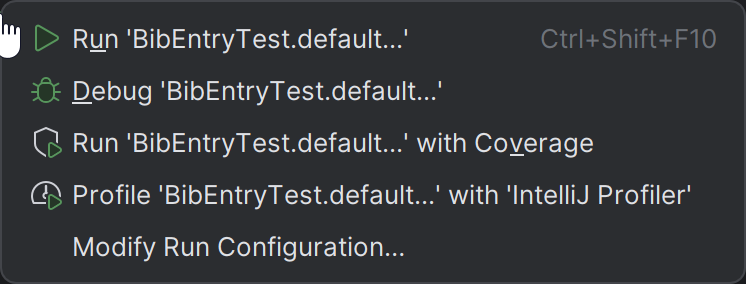
Then, click on it. A popup menu opens. Choose the first entry “Run LocalizationConsistencyTest.findMissingLocalizationKeys” and click on it.
Then, another popup menu opens. Choose “test” as the run task for the test.
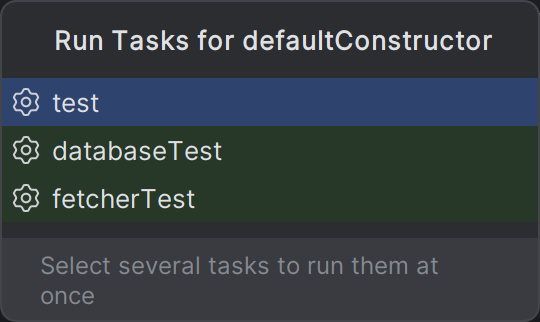
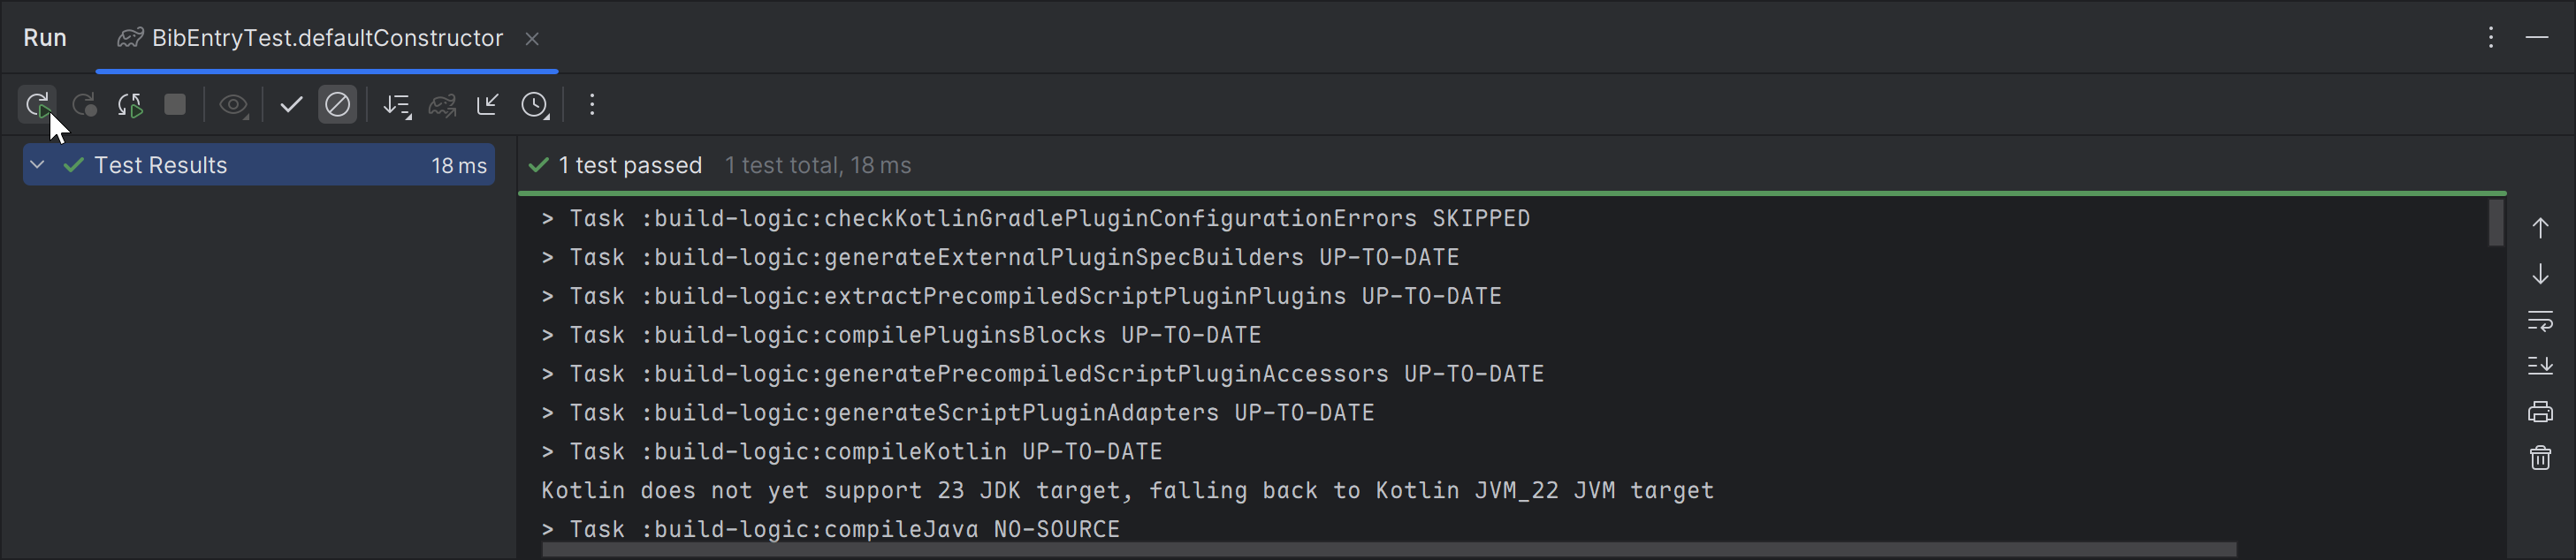
Then, the single test starts.
You also have an entry in the Launch configurations to directly launch the test. You can also click on the debug symbol next to it to enable stopping at breakpoints.

The tests are green after the run. You can also use the play button there to re-execute the tests. A right-click on “findMissingLocalizationKeys” enables the debugger to start.